Introduction
The McMain Dashboard is the first screen displayed when you log in to McMain Online. It provides a clear overview of outstanding work, trends, and key insights into your maintenance process. The dashboard consists of information cards (To-do's) and charts, giving you instant visibility into the current status of work orders, calls, contracts, and more.
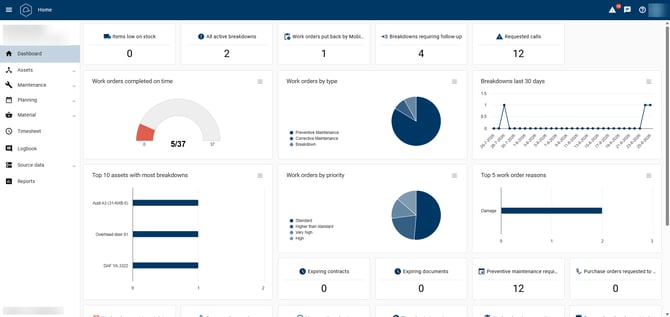
Table of Contents
What is the Dashboard?
The Dashboard consists of information cards (also referred to as To-do's) and charts.
To-do's display the status of entities and the number of records for each status.
Charts display trends and analyses using:
- Line charts
- Bar charts
- Pie charts
- Gauge charts
Each card includes filters such as status, date, crew, shift, or coordinator group. As a result, the information displayed may differ from one employee to another.
To-do's
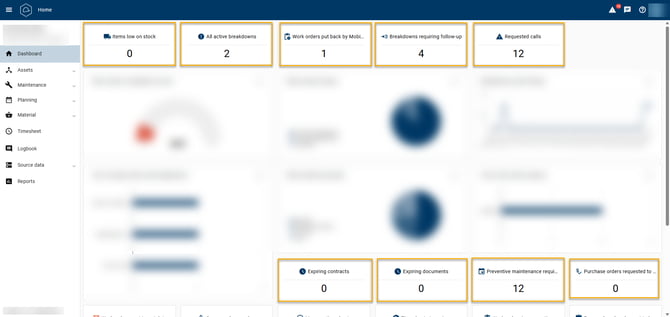
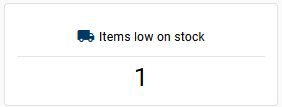
To-do's are information cards that display the number and status of entities.
How does it work?- Click a To-do card.
- A pop-up window opens displaying a list of entities (for example, high-priority work orders).
- Click a record in the list to open the details page of that entity.
- Work Orders
- Calls
- Contracts
- Documents
- Purchase Orders
- Items
- Inspection Lists
- Preventive Maintenance Models
- Timesheets
Charts
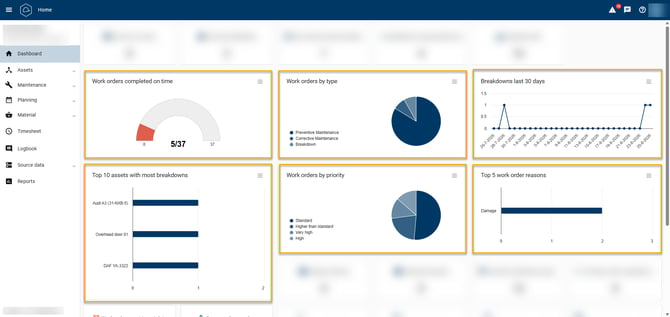
The Dashboard supports four chart types:
- Line chart
- Bar chart
- Pie chart
- Gauge chart
Interaction
- Hover your mouse over a chart to display additional information.
- Click a section of a chart to open a pop-up window containing the related work orders.
- Click a record in the list to open the details page of the selected work order.
Use the hamburger menu in the upper-right corner of a chart to:
- Enlarge the chart
- Download the chart as:
- PNG
- JPEG
- SVG
Pie chart functionality
Pie charts provide an additional filtering option. Click a category to hide or display it.
For example:
- Standard
- High
- Highest Priority
Configuring the Dashboard
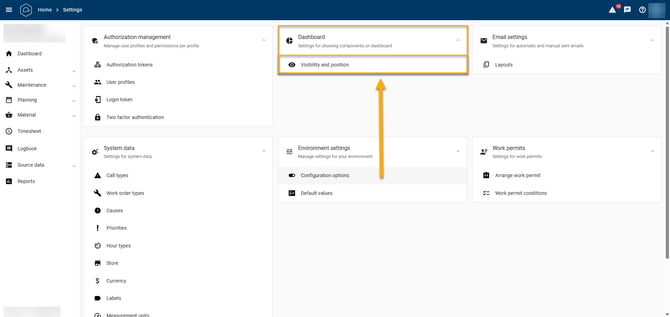
The visibility and position of dashboard cards and charts can be customized.
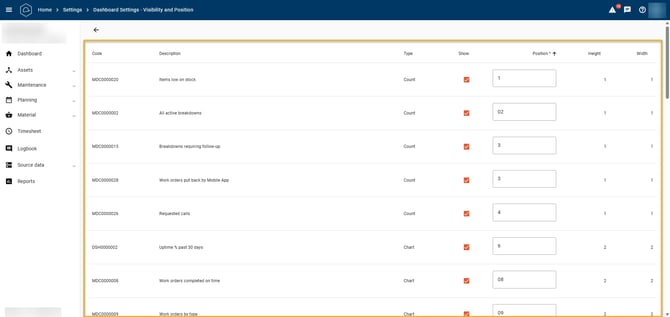
Dashboard cards can be viewed, enabled or disabled, and repositioned from this screen: Settings > Dashboard - Visibility and position
The position of each card is determined using a grid layout, where 01 represents the upper-left position. The numbering then continues following the normal reading order.
Opening the Dashboard settings- Navigate to Settings > Dashboard – Visibility and Position.
- Your user profile must include function code F200.
| Column | Description |
|---|---|
| Code | Identifies the card or chart (read-only). |
| Description | Description of the card or chart. |
| Type | Card = To-do, Chart = chart. |
| Show | Select to display the card or chart. |
| Position | Determines the order on the Dashboard (for example: 01, 02, 03). |
| Height | Height of the card or chart. |
| Width | Width of the card or chart. |
Examples of available cards
Some examples of available dashboard cards are shown below.
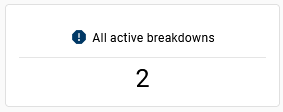
MDC0000002 – All Active Breakdowns
Displays all breakdown work orders with the status Released.
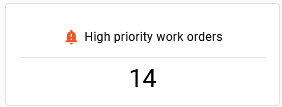
MDC0000005 – High Priority Work Orders
Displays work orders with the status Released or On Hold and a priority of 1, 2 or 3.
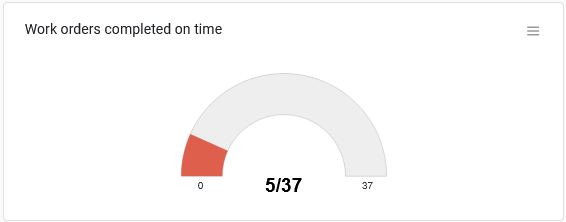
MDC0000008 – Work Orders Completed on Time
Gauge chart showing the percentage of work orders completed on time.
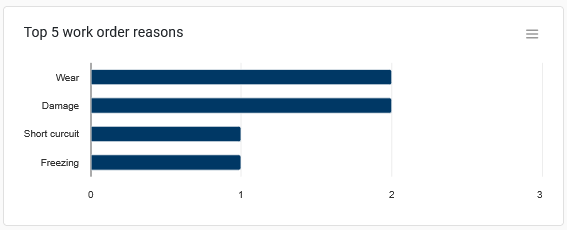
MDC0000011 – Top 5 work order reasons
Bar chart displaying the most common breakdown causes during the last 30 days.
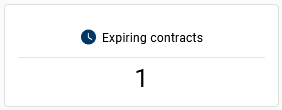
MDC0000014 – Expiring Contracts
Displays contracts that expire within the next 30 days.
Available from: Team
MDC0000020 – Items low on stock
Displays items that have fallen below their configured minimum stock quantity.
Available from: Team